Creating a Chart
The Spreadsheet allows you to create charts quickly using the Charts group of the Insert tab.
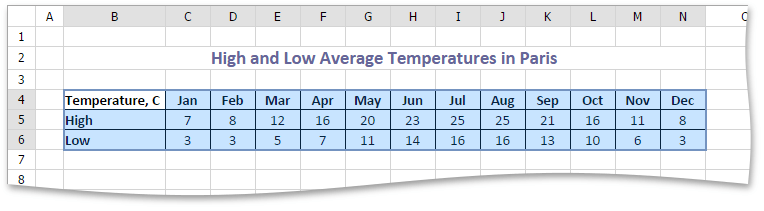
To create a chart, select the table that contains the data you wish to use for the chart. Note that the Spreadsheet only allows you to create charts for data series representing a contiguous cell range.
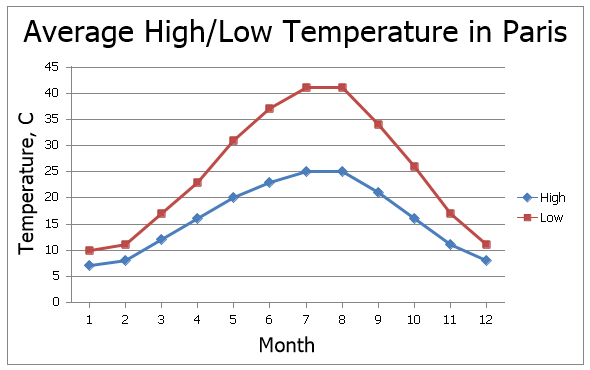
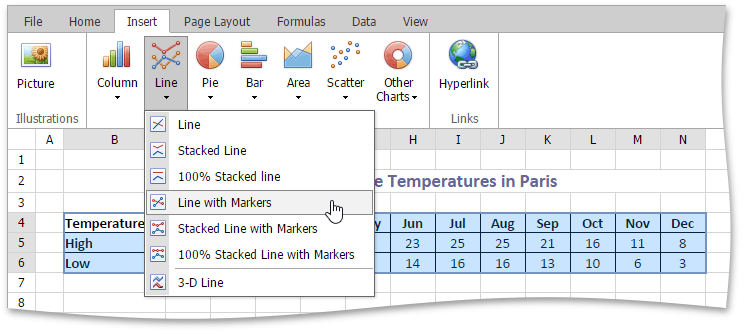
In the Charts group, within the Insert tab, select the required chart type. In the example below, a line chart is created. To insert a line chart, click the Line button, and then select the Line with Markers chart subtype.
The chart is added to the worksheet. You can move the chart to the desired location and resize it for a better fit.