Data Presentation Basics
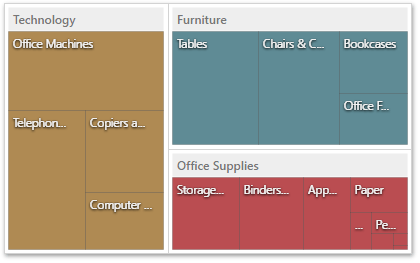
The Treemap dashboard item visualizes data in nested rectangles that are called tiles. Tiles corresponding to child values can be combined by parent values into groups. For example, the Treemap below displays combinations of categories and sub-categories.
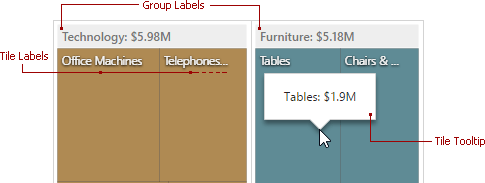
Labels and Tooltips
The Treemap displays labels that contain descriptions for tiles and groups, and provide tooltips with additional information.