Labels
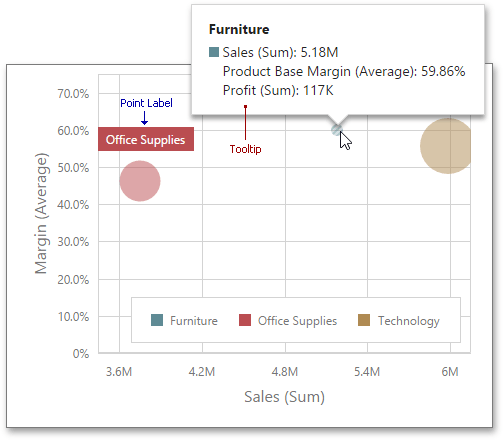
The Scatter Chart can display point labels that contain descriptions for data points, and provide tooltips with additional information.

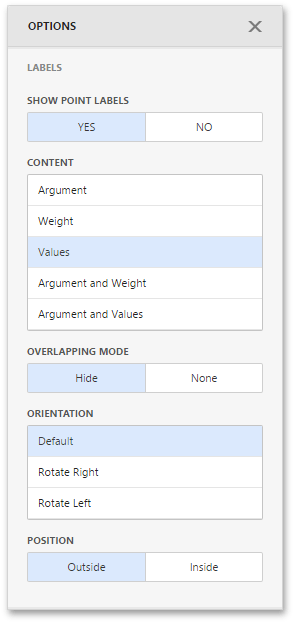
To manage the visibility of point labels, open the Scatter Chart's Options menu and go to the Labels section. Then, turn the Show Point Labels option on.
Here you can specify the type of content displayed within point labels, configure label overlap mode and set the orientation of point labels.
The following options are available.

| Options | Description |
|---|---|
| Show Point Labels | Specifies whether or not to show point labels for the current series. |
| Content | Specifies the type of content displayed within point labels. You can select Value, Argument, Series Name or Argument and Value options. |
| Overlapping Mode | Specifies the label overlap mode. You can hide overlapping labels or disable a resolving algorithm. |
| Orientation | Specifies the orientation of point labels. You can set a default orientation or rotate point labels 90 degrees clockwise or counter clockwise. |
| Position | Specifies the position of point labels relative to bars. Point labels can be displayed inside or outside bars. |