Applying a Predefined Chart Layout and Style
The Spreadsheet allows you to change the appearance of the existing chart by applying one of the predefined layouts and styles.
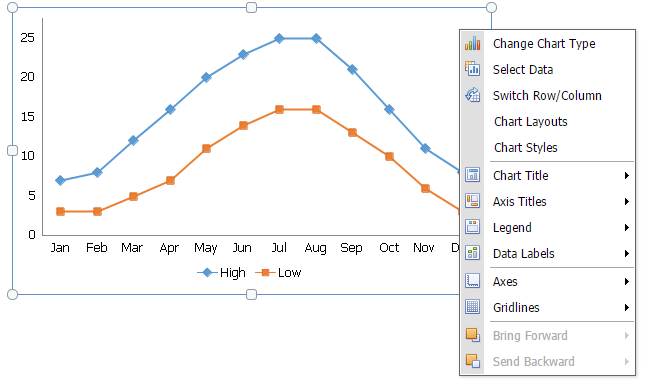
To change a chart style or layout, right-click the chart you wish to format, then select the appropriate item from the opened context menu to invoke dialog boxes.
Apply a Predefined Chart Layout
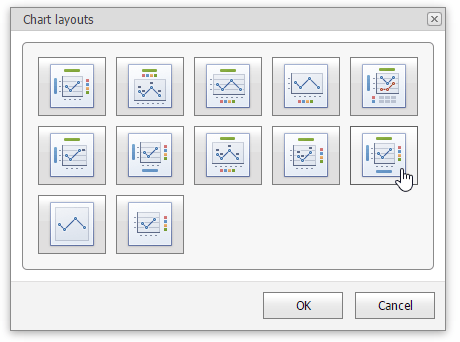
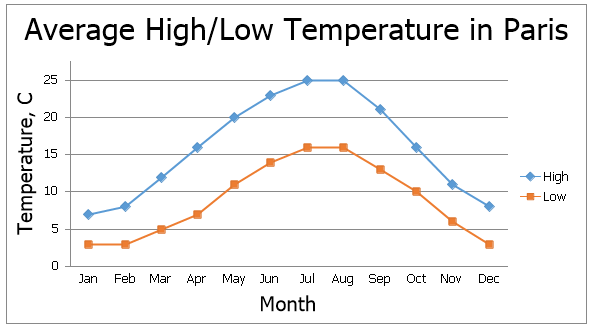
In the Chart Layouts dialog box, select the required chart layout. For example, select Layout 10, which positions the chart legend to the right of the chart area, and adds the chart and axis titles.
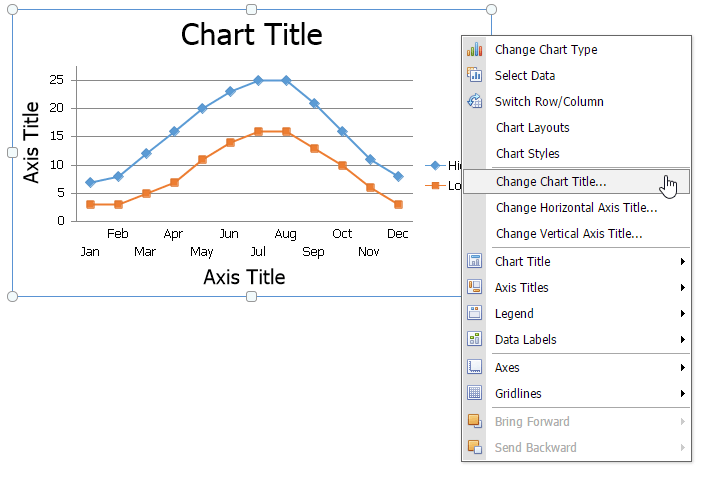
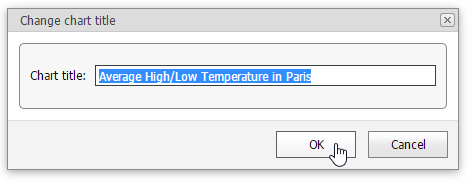
To enter the chart title, right-click the chart and select the Change Chart Title... item in the context menu.
In the invoked Change Chart Title dialog box, enter a title and click OK.
To provide horizontal or vertical axis titles, right-click the chart and select the Change Horizontal Axis Title... or Change Vertical Axis Title... item in the context menu. Type a new title in the invoked dialog box.
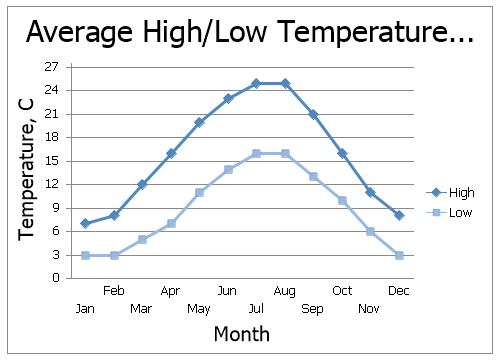
The image below shows the result.
Apply a Predefined Style
Right-click the chart you wish to format and select the Chart Styles item within the context menu to invoke a dialog box. In the opened Chart Styles dialog box, select the required chart style.
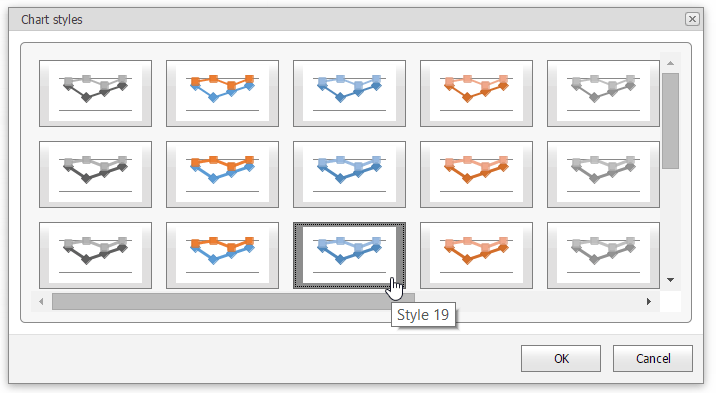
The image below shows a chart with Style 19 applied.